Saturday, May 31, 2014

Transformation frequency of hfq mutants

Over the next week, I plan on preforming experiments to better understand the effect that knocking out hfq has on the natural transformability of Haemophilus influenzae. I'll be repeating and adjusting the experiment already preformed by Rosie here.

To do this, I'll be growing stock of the following cells:


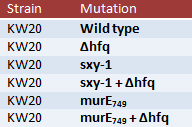
To clarify, Δhfq is the hfq knockout. sxy-1 is a point mutation in the sxy (tfoX) gene that causes hypercompetence, thought to be due to changes in the secondary structure of sxy mRNA that normally inhibits translation of the mRNA (and thus normally inhibits competence). murE749 is different point mutation in the murE gene (responsible for a step in peptidoglycan synthesis) and oddly enough also causes hypercompetence when mutated. The data from the murE mutations will likely not be used in this experiment, but it will perhaps become more useful later as we learn more about murE and hfq.

I will be taking all these cell lines and subjecting them to the following conditions and measuring transformation frequency: 


Here is a breakdown of the experimental logic.
General question: Why does knocking out hfq decrease a culture's transformation frequency?
Theories: 
  1.  The lack of hfq somehow stabilizes sxy mRNA and lowers transformation frequency.
  2.  The lack of hfq prevents spikes of cAMP concentration that are required to induce competence.
  3. Both 1. and 2.
  4. Neither 1. or 2.
Logically speaking, this is every possibility. Practically speaking, the results would be more interesting if they aren't 4.

Predictions under each theory: (underline = prediction)


  •  if hfq is needed to destabilize sxy mRNA as theory 1. would have it, then the sxy-1 mutation would allow destabilization of the RNA strand independent of hfq thus would allow "recovery" of the lack of hfq and have high transformation frequency in all cases
  • if Δhfq reduces cAMP production (theory 2.) then adding cAMP should make up for the transformation frequency defect but we would not expect recovery when extra cAMP is not given
  • theory 3. would say that the phenotype is going to be whatever the most limiting phenotype is predicted from theory 1. and 2.
  • theory 4. cannot make any obvious predictions
This will hopefully reduce any kind of conformation bias when I look at the results (i.e. trying to make the results fit into a theory rather than making the theory fit the results). And of course, these are just predictions. Any theory supported by this experiment would need to be confirmed further by other experiments and any unclear result is not a perfect indicater that any of the theories are wrong, but possibily that the mechanism is more complicated than first thought.


Thursday, May 22, 2014

"Experiment 4" - Transformation

Goal: Measure transformation frequency of KW20 and Δhfq (RR3187).

Method:
  1. Incubate two cell broths (one KW20 and one Δhfq) to an OD600 around 0.25
  2. Filter cells from sBHI solution to MIV solution, grow for 100 minutes
  3. Combine 1 mL cell solution with 1 microgram MAP7 DNA for 15 minutes
  4. Dilute cells and plate dilutions
  5. Count colonies the next day
Results:
Figure 1: Colony Count
  • Notice that the cells plated on the non-antibiotic plate (red bars) are plated at a much more dilute concentration but have more colonies than most of the antibiotic plates did
Figure 2: cfu/mL
  •  We can see the disparity between the two plates here. There appears to be a transformation frequency of about 10^-3 for KW20 and a frequency of roughly 10^-4 for Δhfq
  • I personally don't know if this is a high frequency for Δhfq, I'll have to look it up
Figure 3: An averaged version of the previous graph

What I learned:
  • How to do bar graphs with ggplot2
  • How to make plates (all plates were the first I made; may have impacted results?)
  • How to filter cells
  • Use different volumes when plating a cells to have more countable plates and to calculate a more accurate cfu/mL value
  • give Δhfq more time to grow (small colonies due to slow growth rate)
  • Avoid labeling lids of plates. I accidentally swapped the lid for the 10^-4 plain and antibiotic plates. This gave me temporary confusion when comparing plates the next day.

Wednesday, May 21, 2014

Quick Observation 1 - Δhfq growth rate

I did my first set of transformations today using KW20 and Δhfq (RR3187) strains of H. influenzae. While waiting for the cells to divide I noticed the Δhfq broth took a lot longer to grow...


Turns out this is one of the pleiotropic characteristics of an hfq mutant.


Hfq is further underlined by an interruption of its gene, which... causes pronounced pleiotropic phenotypes such as decreased growth rate, increased cell length, and sensitivity to UV light.

 I'll just have to remember to plan for an extra half hour incubation time when working with Δhfq.

Tuesday, May 20, 2014

"Experiment 3" - Beakers and Growth Rate

Goal: See what effect glassware size has on Haemophilus influenzae growth (i.e. change in OD600 over time). Bonus: also get to see if cfu/mL correctly corresponds with OD600.

Method:
  1. Get different sized beakers
  2. Get H. influenzae from common source
  3. Give each beaker 1.5 cm worth of solution and give duplicate beakers 1.0 cm worth of solution
  4. Incubate, periodically measure OD600 over time
  5. Plate cells every few OD measurements
 Here's a table to clarify:


Beaker # Radius Height of LiquidTotal VolumeVolume of Cell Solution
1 2.5 cm 1.5 cm 20 mL  400 µL
2 2.5 cm 1.0 cm 13.3 mL  267 µL
3 3.5 cm 1.5 cm 39.8 mL 770 µL
4 3.5 cm 1.0 cm 16.7 mL 333 µL
5 4.0 cm 1.5 cm 50 mL 1000 µL

Results:

  
Figure 1: OD600 over time
  • The most obvious thing impacting the slope appears to be the height of the liquid in the beaker. There is a clear distinction between the beakers with 1.0 cm of liquid (2 and 4) and the others with 1.5 cm of liquid. This could actually be the effect of total volume rather than hight (since they are related) however it is interesting to note that beaker 1 and 4 had comparable volumes and were still distinct. 
  • Most likely, the decreasing amount of liquid over time (each measurement took 1 mL of solution) had a larger impact on available resources in the beakers with a shorter liquid height than the beakers with a larger height of solution. 
  • Surprisingly, there seems to be no obvious effect of the size of the beaker (at least not one that can be noticed simply by looking at the graph)  
Figure 2: cfu/mL at different OD600 
  •  The measurement for cfu/mL was calculated based on the number of colonies growing on plates the following day
  •  No strong trends seem to appear between the beakers but beaker 4 appears to be the least viable and beaker 3 appears the most viable  (though it's impossible to say anything for certain without repeating the experiment since two measurements from the same beaker are not independent)
  •  From what little I know about Haemophilus influenzae growth, 10^8 and 10^9 are reasonable values at higher OD600's
Figure 3: Pretty much the same as the previous graph but with colony counts and a fitted curve
  • I couldn't add a line for each beaker in the previous graph because there are not enough measurements per beaker to fit the model I was trying to fit (exponential)
  • Also note that I had to leave out 5 data points (around 0.3) because when I measured the OD, I had not noticed that the pipette I was using was used by someone else who had changed the volume (I didn't notice until after 2 sets of readings)
What I learned:
  • I learned how to code in R over the weekend, these graphs where made entirely from typing code into the R console
  • I learned to check the pipette volume allocation every time you put it down and pick it up later
  • I learned how much liquid should be added to a plate when plating bacteria (I got a lot less contamination compared to last time, however I still had a few alien colonies growing on some plates)
  • Marcelo has informed me that if I want to measure accurate cfu/mL that I plate colonies at multiple dilutions. This sounds reasonable and will be something I keep in mind for future experiments (this will prevent 0 colony plates from affecting the cfu measurement)

Friday, May 16, 2014

"Experiment 2" - Growing and Diluting

Goal: Attempt to get reasonable trends in bacterial growth by plating at different OD600 and at different concentrations.

Method:
  1. Grow cells until they reach an OD600 of 0.10, 0.15, 0.20, 0.25, 0.30
  2. Take 1 mL of solution at each OD and dilute 6, 7, 8 and 9 times (each dilution corresponds to a 10-fold decrease in concentration)
  3. Plate bacteria, count colonies the next day
Results:

Figure 1: Shows that generally the higher the OD, the higher the colony count. As the dilutions get stronger, the trend becomes less obvious


Figure 2: Shows that generally the stronger the dilution, the lower the colony count. This graph also shows that the effect is stronger for higher OD's


I personally take these results very lightly. The overall trend is what should be expected for the most part. Whether or not the details (exact slope, colony count, etc.) match what should be expected is a different story. In this batch, I got a large amount of contamination (which wasn't obvious until 2 days after) which decreases the accuracy and value of the results.

What I learned not to do next time:
  • don't start dumping flasks until AFTER you take a sample of the cells in it (hence the missing OD 0.3 data)
  • set up dilutions beforehand to avoid manic pipetting
  • start the spectrophotometer early in the day because it takes a long time
  • either don't take OD readings as often or add sufficient amount of liquid to avoid consuming it all before reaching your desired level
  • Most importantly... do not add too much liquid to the plate when plating bacteria! I realized after a few plates that adding 0.5 mL of solution to the agar plates was far too much (which I believe is responsible for the contamination. I decided to continue using 0.5 mL for the rest of the plates to keep the data consistent, but never again!

Monday, May 12, 2014

First day

Today was my first official day in the lab. To be honest, at first I was a the first one to arrive today and there was no clear direction of what exactly I should be doing. I first started looking through the literature to learn a little about hfq and sRNA.

After that, I decided that I needed to warm up my practical lab skills so I followed a protocol that other labmates had done: creating a SBHI solution from hemin and NAD+, serial dilutions of KW20 and culture plating at various levels (ranging from 10^6 to 10 colony forming units). I learned quite a bit about where equipment was located, how to use things such as the centrifuge and (relearning) how to pipette. Tomorrow I'll count cultures and get a better idea of how dilute is too dilute and we'll see if my serial dilutions provide expected results.

Sunday, May 11, 2014

First Post

This is my first post for the blog. I hope to keep it updated with what I'm doing at the Redfield lab (http://www.zoology.ubc.ca/~redfield/index.html).

It will soon be filled with research mistakes, blunders and errors (and hopefully by the end, some meaningful science!). Look forward to future updates.